Show clients the work. Include the numbers behind it.
Bring completed work, site health and connected analytics into client reports. Review a manual report before sending, or configure scheduled delivery. Keep your agency’s branding on the PDF.
Keep report history and headline figures together
Open a generated report to review its updates, backups, uptime and available analytics. Client reports can cover several sites belonging to one client. Scheduled delivery and a manually reviewed draft follow separate workflows.
Traffic and search sections need connected data. Missing data stays visible; AI-written commentary does not replace the recorded measurements.
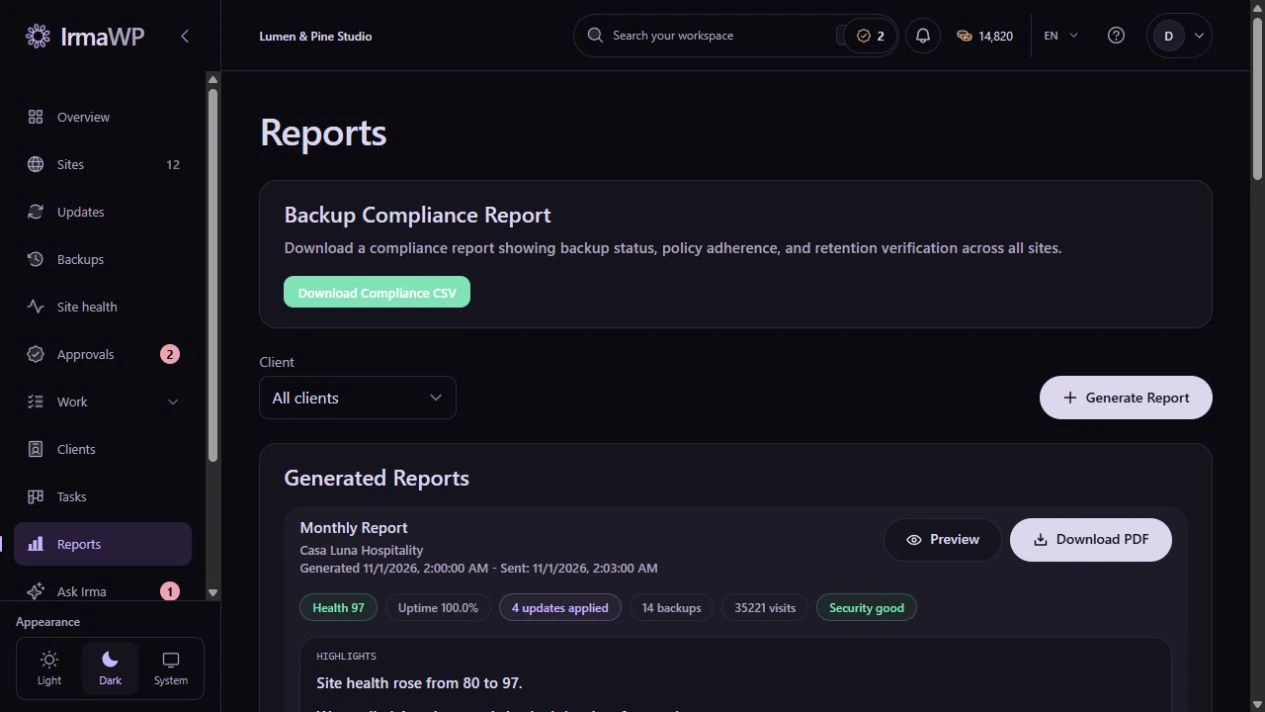
Choose the sections for your report
Choose the site, report type and available sections. The screenshot shows the actual setup in dark mode; the downloadable PDF below shows the client-facing document with fictional data.
Download the example PDF (fictional data)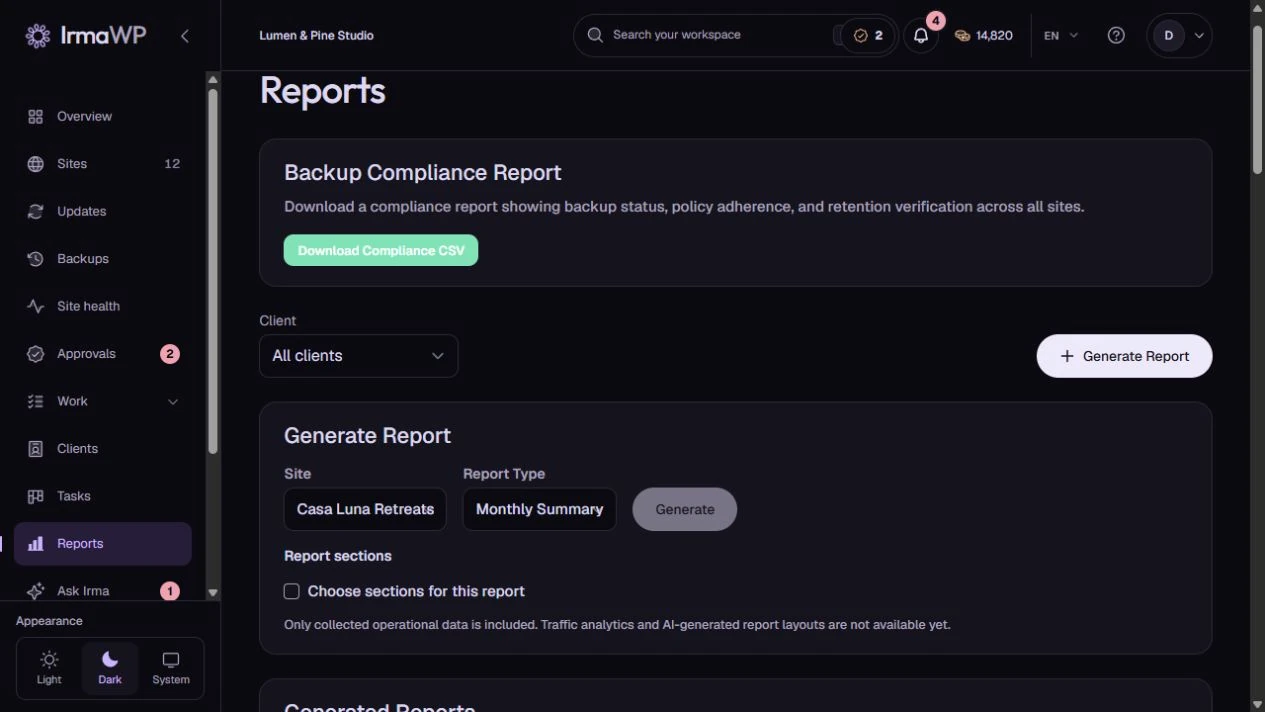
How you use it
Report measured activity
Use available uptime, incidents, updates, backup activity, security scans and performance results. A missing measurement should be marked unavailable, not presented as a perfect score or zero uptime.
Choose the right scope
Keep a site's report focused on that client. Internal workspace records and client-facing output serve different audiences; provider spend is not a client performance metric.
Brand and deliver deliberately
From Starter, your agency logo and colours appear on client portals, PDF reports and client emails. The client logo appears alongside yours in the portal and, when uploaded, on the PDF cover. Agency removes the platform attribution and adds a verified portal domain, sender address and agency-branded WordPress plugin.
What to know
Does it include visitors and top posts from Google Analytics?
What counts as custom reporting?
Start with your own sites.
Connect a small portfolio, check the tools you need, and choose the plan that fits your team's work.

